
The AMFI monthly data on inflows into sub-categories of equity mutual funds sheds interesting facts about investor behaviour. In the endeavour to clock high returns, a lot of money is flowing into mid-cap funds, small-cap funds, multi-cap funds, and sector & thematic funds, without much attention given to the indicative risks involved.
The graph indicates that many of these sub-categories are placed at the higher end of the risk-return spectrum. Simply put, they are high-risk high-return investments.
Graph 1: Risk-Return Spectrum of Equity Mutual Funds
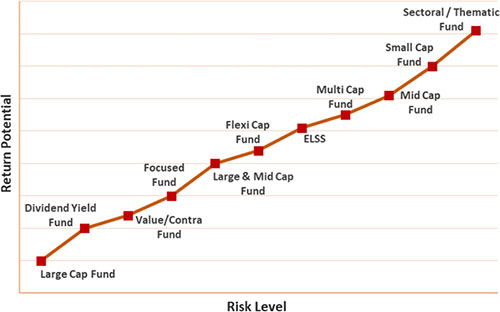
Note: For illustration purposes only
(Source: PersonalFN Research)
“The essence of investment management is the management of risks, not the management of returns.” – Benjamin Graham (the father of value and the author of the book, ‘The Intelligent Investor’).
As a thoughtful and wise investor, you ought to be mindful of the risk involved and not invest blindly going by just the returns. You see, for every level of return you seek, there is a high risk.
It’s important to set your risk-return expectation right when investing in mutual funds and not just be carried away by irrational exuberance.
At present, when the Indian equity markets are at a high, there is no point going gung-ho with equities and disregarding the other important ones, such as debt and gold. If the markets turn volatile or correct, it is debt and gold that could add stability to your investment portfolio.
Near the lifetime of the Indian equity market, what you require to follow is a Multi-Asset Approach vide a Multi-Asset Fund, which shall provide enough diversification–the basic tenet of investing.
While India is a ‘bright spot’ in the global economy with higher GDP growth clocked, the Modi-led- NDA government has initiated several reforms, stressed on ‘Make in India‘ to make India self-reliant and push exports, investments have gone up, and the consumption story is reflecting prosperity, one also needs to watchful of the headwinds.
The following are the key risks to the Indian equity markets:
- Higher international oil prices
- Vulnerable Indian rupee compared to the greenback
- Upward pressure to trade deficit once again
- Worries of India’s Current Account Deficit (CAD) re-emerging
- Probability of a below-normal monsoon in 2023 for the country as a whole (owing to the impact of El Nino weather conditions)
- Risk to the inflation trajectory
- Central banks maintaining hawkish monetary policy stance
- Possibility of higher borrowing rates
- Higher bond yields
- Chances of economic slowdown later this year (or early 2024)
- Weak global demand
- Increase in volatility in the global financial markets
- Geopolitical tension
- And geoeconomic fragmentation
Also, a fact is that compared to most global peers, Indian equities are relatively expensive. The trail P/Es of the MSCI Emerging Markets Index and MSCI World Index trail P/Es (which are around 14x and 20x, respectively, as per their latest factsheets), while that of the Nifty 50 is 23x.
Graph 2: Trail P/E of the Nifty 50 Index

Data as of September 18, 2023
Past performance is not an indicator of future returns.
(Source: BSE, Data Collated by PersonalFN Research)
While the trail P/E of the Nifty 50 Index is below the 5-year average of 26x and may seem reasonable, considering that India is a bright spot in the global economy, the margin of safety seems to have narrowed. Even on a 12-month forward P/E, India is commanding a premium vis-a-vis the emerging markets and the world.
India’s market capitalisation-to-GDP ratio, famously called the Buffett indicator (named after legendary investor Warren Buffett), has also moved up to 99.4% (from 96.9% in the previous month), and is near the modestly overvalued range. The valuations in the mid-caps and small-caps, particularly, are overstretched.
It’s time to be conscious and cautious about this and not get carried away.
“Be fearful when others are greedy, and greedy when others are fearful.” — Warren Buffett.
If equity markets correct, i.e. descend from the current levels for any reason, debt and gold would help reduce the downside risk.
Graph 3: Performance of equity, debt, and Gold in the respective calendar years
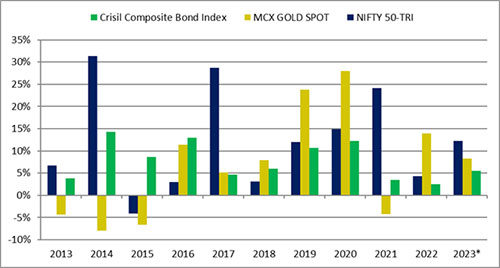
*Data as of September 18, 2023MCX spot price of gold used.
Past performance is not an indicator of future returns.
(Source: MCX, ACE MF, Data collated by PersonalFN Research)
The graph above reveals that in times when equities have disappointed investors — as they did in the calendar years 2015, 2016, 2018, and 2022 — it is usually debt and gold, that fare well.
At a time when yields are elevated and may increase, it makes sense to invest in fixed-income instruments and debt funds wherein the debt fund manager follows an accrual strategy to invest in quality debt papers.
Similarly, against the backdrop of the emerging risks, which shall add to economic uncertainty, holding gold could prove to be a safe haven, command a store of value, and prove to be an effective portfolio diversifier. Graph 3 clearly highlights the importance of following a Multi-Asset Approach.
A Multi-Asset Fund is a Meaningful Choice
It makes sense to invest in a Multi-Asset Fund near the lifetime high of the Indian equity markets, as you could benefit from the tactical allocation across equity, debt, and gold.
A Multi-Asset Fund is mandated to invest at least 10% each in equity, debt, and gold. The allocation between equity, debt, and gold is usually dynamic (meaning it changes) and is backed by the fund management teams’ outlook for the respective asset class.
If favourable opportunities exist for wealth creation, the fund manager could skew the portfolio to equities, whereas when the valuations are expensive and the margin of safety is narrow, debt may be preferred (particularly when yields look attractive).
Similarly, to hedge the portfolio in times of economic uncertainty, the fund manager could allocate some portion of the net assets to gold.
Usually, a Multi-Asset Fund allocates around 35%-65% in equities (across market capitalisations and sectors), anywhere between 25%-55% in debt & money market instruments, and up to 20% in gold.
The fund manager considers the equity market valuations, the macroeconomic undercurrents, the interest rate cycle, bond yields, and the growth potential of the respective asset classes, among a host of other factors when actively allocating to equity, debt, and gold-the three key asset classes.
So, at present, if the fund manager believes valuations in Indian equities are stretched, the exposure to equities would be kept limited while it may be increased to high-quality debt and gold.
Typically, the risks that a Multi-Asset Fund manager faces are price risk of equities, allocation risk (i.e. at times the allocation may not be optimal, which in turn could weigh on the returns and risk), and risk associated with investment in gold.
However, the risk-reward of the Multi-Asset Fund is usually well-balanced and generates steady and decent returns. You don’t have to depend on a single asset class to clock decent returns. The distinctive risk-return traits of the three asset classes — equity, debt, and gold — help limit the risk.
As regards benchmarking the performance, based on how the total assets are distributed, a Multi-Asset Fund benchmarks its performance against a combination of indices, such as the CRISIL Composite Bond Fund Index + S&P BSE Sensex Total Return Index + Domestic price of Gold (or any other appropriate index).
How have Multi-Asset Funds Fared?
Multi-Asset Funds, as a category, have clocked a respectable 18.33% CAGR over 3-year, and a decent 14.84% CAGR and 12.68% CAGR over 5-years and 7-year periods, respectively, performing better than the category average compounded annualised returns posted by Balanced Advantage Funds (also known as Dynamic Asset Allocation Funds) that have the mandate to manage their assets dynamically between equities and debt instruments.
Table 1: The historical returns and risk ratios of Multi-Asset Funds
| Scheme Name | Absolute (%) | CAGR (%) | Ratio | ||||||||
| 6 Months | 1 Year | 2 Years | 3 Years | 5 Years | 7 Years | SD Annualised | Sharpe | ||||
| Quant Multi Asset Fund | 13.57 | 13.14 | 16.43 | 28.63 | 23.55 | 17.28 | 15.27 | 0.41 | |||
| ICICI Pru Multi-Asset Fund | 17.08 | 22.97 | 18.70 | 28.53 | 17.02 | 15.92 | 11.95 | 0.47 | |||
| Tata Multi Asset Opp Fund | 15.07 | 16.60 | 11.70 | 20.17 | — | — | 8.65 | 0.44 | |||
| Nippon India Multi Asset Fund | 16.94 | 19.54 | 11.12 | 17.83 | — | — | 8.88 | 0.36 | |||
| HDFC Multi-Asset Fund | 13.08 | 15.71 | 10.05 | 16.93 | 13.11 | 11.42 | 7.83 | 0.38 | |||
| Axis Multi Asset Allocation Fund | 14.61 | 9.12 | 2.90 | 14.83 | 12.43 | 10.98 | 11.84 | 0.21 | |||
| SBI Multi Asset Allocation Fund | 16.21 | 18.50 | 11.43 | 14.76 | 12.78 | 10.95 | 7.07 | 0.33 | |||
| UTI Multi Asset Fund | 17.17 | 19.77 | 10.44 | 14.26 | 10.14 | 9.55 | 8.11 | 0.27 | |||
| Motilal Oswal Multi Asset Fund | 16.82 | 18.33 | 8.96 | 9.05 | — | — | 5.06 | 0.15 | |||
| Aditya Birla SL Multi Asset Allocation Fund | 16.22 | — | — | — | — | — | 6.42 | 0.78 | |||
| Baroda BNP Paribas Multi Asset Fund | 14.67 | — | — | — | — | — | 5.26 | 0.64 | |||
| Category Average – Multi Asset Allocation Fund | 15.59 | 17.08 | 11.30 | 18.33 | 14.84 | 12.68 | 8.76 | 0.40 | |||
| HDFC Balanced Advantage Fund | 19.85 | 24.13 | 19.16 | 29.35 | 16.07 | 14.77 | 13.53 | 0.43 | |||
| Baroda BNP Paribas Balanced Advantage Fund | 16.59 | 16.71 | 10.00 | 16.27 | — | — | 9.21 | 0.31 | |||
| Tata Balanced Adv Fund | 13.41 | 14.43 | 10.05 | 15.96 | — | — | 6.68 | 0.41 | |||
| Aditya Birla SL Balanced Advantage Fund | 13.93 | 14.09 | 8.31 | 15.76 | 11.77 | 10.96 | 8.09 | 0.32 | |||
| ICICI Pru Balanced Advantage Fund | 12.03 | 13.06 | 10.39 | 15.59 | 12.07 | 11.38 | 6.17 | 0.41 | |||
| Nippon India Balanced Advantage Fund | 13.19 | 12.41 | 8.67 | 15.46 | 11.35 | 11.33 | 7.44 | 0.34 | |||
| Axis Balanced Advantage Fund | 15.26 | 13.46 | 6.86 | 13.67 | 9.52 | — | 7.79 | 0.27 | |||
| Kotak Balanced Advantage Fund | 12.08 | 13.28 | 8.42 | 13.25 | 11.94 | — | 6.19 | 0.33 | |||
| Bank of India Balanced Advantage Fund | 14.60 | 13.41 | 13.12 | 13.03 | 7.49 | 7.14 | 11.22 | 0.17 | |||
| ITI Balanced Advantage Fund | 12.93 | 13.67 | 6.69 | 13.00 | — | — | 7.61 | 0.25 | |||
| Union Balanced Advantage Fund | 11.07 | 11.70 | 7.08 | 12.54 | 11.51 | — | 6.44 | 0.27 | |||
| Bandhan Balanced Advantage Fund | 14.05 | 11.30 | 5.77 | 11.64 | 10.05 | 9.91 | 7.78 | 0.21 | |||
| HSBC Balanced Advantage Fund | 12.97 | 13.41 | 7.13 | 10.14 | 9.57 | 9.24 | 5.46 | 0.22 | |||
| LIC MF Balanced Advantage Fund | 13.07 | 13.43 | — | — | — | — | 7.38 | 0.14 | |||
| Mahindra Manulife Balanced Advantage Fund | 16.45 | 14.67 | — | — | — | — | 8.96 | 0.14 | |||
| NJ Balanced Advantage Fund | 14.10 | 15.14 | — | — | — | — | 8.79 | 0.04 | |||
| SBI Balanced Advantage Fund | 14.17 | 17.33 | 11.11 | — | — | — | 6.25 | 0.22 | |||
| WOC Balanced Advantage Fund | 14.76 | — | — | — | — | — | 5.31 | 0.89 | |||
| Category Average – Balanced Advantage Fund | 14.14 | 14.45 | 9.48 | 15.05 | 11.13 | 10.68 | 7.80 | 0.30 | |||
| CRISIL Composite Bond Index | 4.16 | 7.14 | 4.25 | 4.83 | 7.87 | 6.87 | 2.71 | -0.13 | |||
| CRISIL Hybrid 35+65 – Aggressive Index | 15.18 | 12.46 | 7.51 | 16.72 | 12.47 | 12.13 | 9.92 | 0.28 | |||
| CRISIL Short Term Bond Index | 3.96 | 7.01 | 4.86 | 5.32 | 7.26 | 6.92 | 1.50 | -0.16 | |||
| NIFTY 50 – TRI | 18.67 | 16.02 | 8.27 | 21.96 | 13.62 | 13.95 | 14.60 | 0.30 | |||
| S&P BSE 200 – TRI | 21.46 | 15.16 | 8.99 | 23.21 | 14.13 | 14.31 | 15.00 | 0.32 | |||
| S&P BSE SENSEX – TRI | 17.69 | 16.41 | 8.40 | 21.75 | 13.99 | 14.43 | 14.73 | 0.29 | |||
Data as of September 18, 2023
The securities quoted are for illustration only and are not recommendatory.
Direct Plan-Growth option considered.
Returns considered are point-to-point and expressed in %.
Returns over 1 year are compounded annualised; else absolute.
Standard Deviation indicates Total Risk, while Sharpe and Sortino Ratios measure the Risk-Adjusted Return. They are calculated over a 3-Yr period assuming a risk-free rate of 6% p.a
Past performance is not an indicator of future returns.
The table above is NOT a recommendation as such. Speak to your investment advisor for further assistance before investing.
Mutual Fund investments are subject to market risks. Read all scheme-related documents carefully.
(Source: ACE MF; Data collated by PersonalFN Research)
Having said that, not all Mult-Asset Funds have done well; some schemes such as Motilal Oswal Multi Asset Fund, UTI Multi Asset Fund, SBI Multi Asset Allocation Fund, Axis Multi Asset Allocation Fund, and a few others have clocked returns lower than their category average as well as underperformed the balanced advantage funds category average returns.
Only Quant Multi Asset Fund, ICICI Pru Multi-Asset Fund, and Tata Multi Asset Opp Fund have outperformed the category average return of Multi-Asset Funds and CRISIL Hybrid 35+65 – Aggressive Index and the bellwether indices, viz. the Nifty 50 -TRI and S&P BSE Sensex.
Table 2: Performance Across Market Cycles of Multi-Asset Funds v/s Balanced Advantage Funds
| Scheme Name | Bull Phase (%) | Bear Phase (%) | Bull Phase (%) | Bear Phase (%) | Bull Phase (%) | Bear Phase (%) | Bull Phase (%) |
| 09-Mar-09 To 05-Nov-10 | 05-Nov-10 To 20-Dec-11 | 20-Dec-11 To 03-Mar-15 | 03-Mar-15 To 25-Feb-16 | 25-Feb-16 To 14-Jan-20 | 14-Jan-20 To 23-Mar-20 | 23-Mar-20 To 18-Sep-23 | |
| Axis Multi Asset Allocation Fund | — | 1.31 | 12.42 | -3.88 | 11.78 | -25.45 | 23.05 |
| HDFC Multi-Asset Fund | 19.47 | 5.43 | 12.43 | 1.65 | 8.99 | -25.96 | 26.86 |
| ICICI Pru Multi-Asset Fund | 75.36 | -19.67 | 28.74 | -18.75 | 16.97 | -30.43 | 35.50 |
| Quant Multi Asset Fund | 4.06 | 6.33 | 7.24 | 5.04 | 8.34 | -31.15 | 44.03 |
| SBI Multi Asset Allocation Fund | 11.35 | 2.77 | 12.71 | 6.45 | 9.55 | -16.30 | 20.45 |
| Tata Multi Asset Opp Fund | — | — | — | — | — | — | 27.11 |
| UTI Multi Asset Fund | 56.99 | -9.90 | 15.62 | -15.43 | 10.27 | -24.24 | 22.76 |
| Category Average – Multi Asset Allocation Fund | 33.45 | -2.29 | 14.86 | -4.15 | 10.99 | -25.59 | 28.54 |
| Aditya Birla SL Balanced Advantage Fund | 55.25 | -16.61 | 18.28 | -10.92 | 15.04 | -25.98 | 23.73 |
| Axis Balanced Advantage Fund | — | — | — | — | — | -15.35 | 16.99 |
| Bandhan Balanced Advantage Fund | — | — | — | -5.93 | 10.56 | -23.66 | 20.47 |
| Bank of India Balanced Advantage Fund | — | — | — | -3.04 | 5.63 | -13.70 | 16.77 |
| Baroda BNP Paribas Balanced Advantage Fund | — | — | — | — | — | -19.06 | 25.19 |
| HDFC Balanced Advantage Fund | 89.12 | -22.83 | 22.82 | -18.03 | 16.48 | -33.25 | 35.36 |
| HSBC Balanced Advantage Fund | — | — | 30.16 | -12.30 | 10.12 | -18.59 | 17.67 |
| ICICI Pru Balanced Advantage Fund | 46.27 | -9.78 | 24.22 | -6.71 | 14.64 | -26.73 | 23.91 |
| ITI Balanced Advantage Fund | — | — | — | — | — | -32.43 | 18.86 |
| Kotak Balanced Advantage Fund | — | — | — | — | — | -25.61 | 22.86 |
| Nippon India Balanced Advantage Fund | 92.13 | -26.30 | 29.10 | -22.25 | 16.21 | -20.91 | 21.12 |
| Tata Balanced Adv Fund | — | — | — | — | — | -19.37 | 22.85 |
| Union Balanced Advantage Fund | — | — | — | — | — | -23.59 | 22.17 |
| Category Average – Balanced Advantage Fund | 70.69 | -18.88 | 24.92 | -11.31 | 12.67 | -22.94 | 22.15 |
| CRISIL Composite Bond Index | 5.11 | 6.82 | 9.13 | 6.06 | 8.83 | 0.86 | 6.52 |
| CRISIL Hybrid 35+65 – Aggressive Index | 93.97 | -30.87 | 20.65 | -11.46 | 14.37 | -25.07 | 24.69 |
| CRISIL Short Term Bond Index | 5.25 | 7.40 | 9.25 | 7.68 | 8.18 | -0.01 | 6.67 |
| S&P BSE 200 – TRI | 87.03 | -27.65 | 26.88 | -20.04 | 17.14 | -37.68 | 35.28 |
| NIFTY 50 – TRI | 73.60 | -24.62 | 25.26 | -21.71 | 17.45 | -38.27 | 33.72 |
| S&P BSE 200 – TRI | 79.43 | -24.19 | 25.14 | -20.04 | 17.14 | -37.68 | 33.18 |
Data as of September 18, 2023
The securities quoted are for illustration only and are not recommendatory.
Direct Plan-Growth option considered.
Returns considered are point-to-point and expressed in %.
Returns over 1 year are compounded annualised; else absolute.
Past performance is not an indicator of future returns.
The table above is NOT a recommendation as such. Speak to your investment advisor for further assistance before investing.
Mutual Fund investments are subject to market risks. Read all scheme-related documents carefully.
(Source: ACE MF; Data collated by PersonalFN Research)
Barring the knee-jerk reaction of the Indian equity markets in view of the COVID-19 pandemic, in all other bear phases, Multi-Asset Funds have protected the downside risk better than the Balanced Advantage Funds (also known as Dynamic Asset Allocation Funds), as seen in Table 2.
This shows that a Multi-Asset Fund with exposure to equity, debt, and gold is far more balanced and helps manage risk better than a Balance Advantage Fund.
Even in the recent bull phase since the low of March 23, 2020, the Multi-Asset Fund category has rewarded superior returns to investors better than the Balanced Advantage Funds category.
That being said, care needs to be taken to select a Multi-Asset Fund to invest in.
The Key Advantages of Investing in a Multi-Asset Fund
If you select a Multi-Asset Fund prudently considering a host of quantitative and qualitative parameters (and not just historical returns), it could adduce the following seven key benefits:
- Facilitate tactical asset allocation to equity, debt, and gold
- Provide relief from timing the market and rebalancing the portfolio
- Benefit from the research capabilities of a professional fund management team
- Possibly lower the cost of investing
- Provide diversification
- Reduce risk and optimise returns
- And make portfolio tracking easy (instead of tracking different schemes across categories and sub-categories therein).
In addition to the above, since Multi-Asset Funds usually have 65% or more net assets deployed in equities, they are classified as equity-oriented hybrid schemes for taxation. The capital gains are taxed like any other equity-oriented mutual fund scheme.
[Read: 3-Tiered Taxation of Mutual Funds: Here’s All You Need to Know]
Having said that, be mindful of schemes positioned as a ‘Multi-Asset Fund of Fund’, which are classified as non-equity oriented or debt mutual fund schemes from a taxation standpoint, wherein the indexation is no longer available on capital gain and taxed at the marginal rate of taxation, i.e., as per one’s income-tax slab.
Who Should Invest in Multi-Asset Funds?
Multi-Asset Funds are a suitable choice if you are looking for long-term capital appreciation, have a moderately high-risk appetite, and have an investment time horizon of 3 to 5 years. These schemes are befitting for both novice as well as seasoned investors, particularly when Indian equities are near a lifetime high.
Several mutual fund houses have recently come up with Multi-Asset Funds, and many more fund houses are expected to introduce Multi-Asset Funds at elevated levels of the Indian equity markets but choose wisely. It would be worthwhile opting for the existing Multi-Asset Funds with an established performance track record across market cycles.
Happy Investing!
This article first appeared on PersonalFN here


