
Riding on a wave of exuberance, the Indian equity market, i.e., bellwether S&P BSE Sensex, scaled to a new lifetime high of 63,588.31 points in the early trade on June 21, 2023 while the Nifty 50 hovered near its all-time high (of 18,887.60 points). A promising economic future supported by reforms, investments, and consumption, even amid fears of global recession, has made India a promising investment destination among emerging market economies.
However, compared to most global peers, India is relatively expensive. The Morgan Stanley Capital International (MSCI) India Index Price-to-Equity (P/E/) ratio is over 25x, while the MSCI Emerging Markets Index and MSCI World Index trail P/Es are around 13x and 20x (as per the latest factsheets). Even on a 12-month forward P/E, India is commanding a premium vis-a-vis the emerging markets and the world.
Now, while valuation premium may look justified given India’s bright economic prospects and corporate earnings data, a fact is that foreign investors particularly, are not finding much comfort in the relative valuations when the other Asian markets are trading at cheaper valuations.
Graph 1: Trail P/E of the Nifty 50 Index
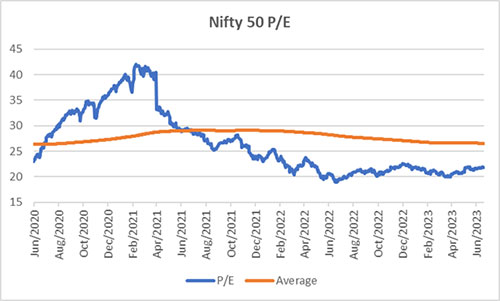
Data as of June 19, 2023
(Source: BSE, Data Collated by PersonalFN Research)
Even though the Price-to-Equity (P/E) Ratio of the Nifty 50 has come off from its peak, it is above 20x– a level where valuations can’t be termed as cheap. But that does not mean markets would descend, as the Indian equity markets are not very expensive either. The margin of safety appears to have narrowed a bit.
Going forward, the possibility of global recession, inflation moving up again (particularly on account of EL-Nino conditions, an uncertain outlook for crude oil prices, and higher input costs and output prices), and geopolitical tensions are some of the key risks. Indian equities are unlikely to remain immune if these risks become apparent.
Thus, it would be better to avoid skewing the investment portfolio too much to equities swayed by irrational exuberance.
Graph 2: Performance of equity, debt, and gold in the respective calendar years
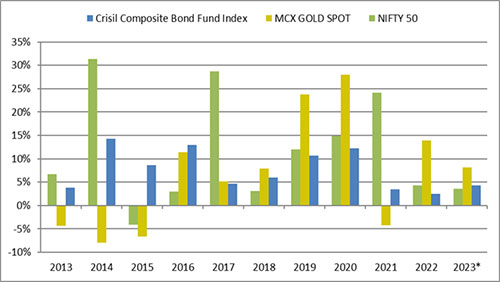
Data as of June 19, 2023
MCX spot price of gold used.
Past performance is not an indicator of future returns.
(Source: MCX, ACE MF, Data collated by PersonalFN Research)
The graph above vindicates that not all assets move in the same direction always. There have been years when equities have rewarded investors with stellar returns and, at times, disappointed investors (like in the years 2011, 2015, 2018, and 2022). During periods where equities have generated negative or lacklustre returns, it is usually debt and gold that have done well and added stability to the portfolio.
Hence it makes sense to follow a sensible multi-asset approach, wherein the investible surplus is deployed across asset classes –equity, debt, and gold.
If the world indeed slips into a recession, financial stability is threatened by geopolitical tensions, there are supply chain disruptions, and inflation rises, gold would continue to exhibit its lustre. It makes a case to invest in gold ETFs and/or gold savings funds.
[Read: Why Gold Would Continue to Shine in 2023]
Similarly, turbulence in equities along with a higher global debt environment, could push bond yields up. The short-term U.S. treasury yields have risen once again after the Federal Reserve kept policy rates unchanged but signalled it could still raise interest rates to get inflation down. In India as well, while the RBI has maintained a status quo on policy rates in the last two bi-monthly monetary policy meetings, the focus on the withdrawal of an accommodative stance (to ensure that inflation progressively aligns with the target while supporting growth), indicates that the RBI is not done yet increasing policy rates–another 25 to 35 basis points increase is possible. Recognising this, the 10-year benchmark Government-securities yield has already hardened a bit. It is an opportune time to now invest in longer-duration debt mutual funds as we near the peak of the interest rate upcycle. You could benefit from higher yield and unlock capital growth. That said, pay attention to your risk appetite and liquidity needs. Don’t blindly invest in any debt mutual fund.
[Read: RBI Maintains Status Quo on Policy Rates. Strategy to Invest in Debt Mutual Funds Now]
As an investor, if you feel that understanding the dynamics of every asset class is not your cup, yet wish to follow a multi-asset allocation strategy, then a Multi-Asset Fund is a meaningful choice to tactically allocate the investible surplus to equity, debt, and gold with a single fund (leaving it to the expertise of a professional fund manager).
Multi-Asset Fund
As per the regulations, a Multi-Asset Fund is mandated to invest a minimum allocation of 10% each in equity, debt, and gold. The rest is managed dynamically depending on how the fund manager and his team perceive the valuations in the equity markets, the outlook on interest rates, the macroeconomic undercurrents, and the growth potential of the respective asset class.
For instance, in the current scenario if the fund manager believes that the equity market is overvalued and the margin of safety is narrow; he/she will trim exposure to equities and simultaneously hike its exposure in debt and/or gold.
So, a Multi-Asset Fund helps to gain tactical exposure to equity, debt, and gold, which usually share a low correlation. This allows the fund manager to potentially balance the risk and reward and deliver steady returns in the long term, even when the market turns volatile.
As regards benchmarking the performance, based on how the total assets are distributed, a Multi-Asset Fund benchmarks its performance against a combination of indices, such as the CRISIL Composite Bond Fund Index + S&P BSE Sensex Total Return Index + Domestic price of Gold (or any other appropriate index).
It is important to choose a Multi-Asset Fund prudently.
As an investor, prudently evaluate if the Multi-Asset Fund under consideration has been able to meet its stated investment objective — in terms of returns clocked, the risk exposure — what is the asset allocation to the three asset classes, the underlying portfolio, and the investment processes and systems at the fund house.
Table 1: The historical returns and risk ratios of Multi-Asset Funds
| Scheme Name | 6 Months | 1 Year | 2 Years | 3 Years | 5 Years | 7 Years | SD Annualised | Sharpe |
| Aditya Birla SL Multi Asset Allocation Fund | — | — | — | — | — | — | 7.85 | 0.60 |
| Axis Multi Asset Allocation Fund | 3.13 | 16.68 | 6.77 | 17.05 | 11.84 | 11.12 | 12.41 | 0.28 |
| Baroda BNP Paribas Multi Asset Fund | 5.16 | — | — | — | — | — | 4.55 | 0.27 |
| HDFC Multi-Asset Fund | 4.95 | 18.64 | 11.09 | 19.66 | 12.30 | 11.23 | 9.40 | 0.44 |
| ICICI Pru Multi-Asset Fund | 5.63 | 24.14 | 19.43 | 27.34 | 15.76 | 16.20 | 12.23 | 0.48 |
| Motilal Oswal Multi Asset Fund | 4.88 | 10.99 | 4.87 | — | — | — | 4.34 | -0.01 |
| Nippon India Multi Asset Fund | 6.96 | 21.00 | 11.73 | — | — | — | 9.10 | 0.32 |
| Quant Multi Asset Fund | 0.48 | 24.42 | 16.23 | 38.22 | 22.04 | 16.83 | 18.77 | 0.46 |
| SBI Multi Asset Allocation Fund | 5.50 | 19.60 | 10.13 | 13.98 | 11.02 | 10.29 | 7.33 | 0.32 |
| Tata Multi Asset Opp Fund | 4.11 | 20.91 | 12.11 | 21.26 | — | — | 9.10 | 0.49 |
| UTI Multi Asset Fund | 8.58 | 26.79 | 10.79 | 15.84 | 9.38 | 9.62 | 9.07 | 0.33 |
| WOC Multi Asset Allocation Fund | — | — | — | — | — | — | — | — |
| Category Average – Multi Asset Allocation Fund | 4.94 | 20.35 | 11.46 | 21.91 | 13.72 | 12.55 | 9.47 | 0.36 |
| Aditya Birla SL Balanced Advantage Fund | 4.52 | 17.91 | 8.55 | 16.60 | 11.11 | 11.59 | 9.05 | 0.37 |
| Axis Balanced Advantage Fund | 4.71 | 16.25 | 8.50 | 13.20 | 8.80 | — | 7.98 | 0.29 |
| Bandhan Balanced Advantage Fund | 5.53 | 18.31 | 7.43 | 13.02 | 9.52 | 9.92 | 8.53 | 0.27 |
| Bank of India Balanced Advantage Fund | 2.18 | 17.43 | 11.39 | 12.47 | 6.31 | 6.86 | 11.24 | 0.18 |
| Baroda BNP Paribas Balanced Advantage Fund | 5.50 | 24.00 | 11.16 | 18.77 | — | — | 10.12 | 0.37 |
| HDFC Balanced Advantage Fund | 5.96 | 27.62 | 17.25 | 27.72 | 14.53 | 14.68 | 14.11 | 0.44 |
| HSBC Balanced Advantage Fund | 4.97 | 15.08 | 7.03 | 11.20 | 8.56 | 9.00 | 6.15 | 0.27 |
| ICICI Pru Balanced Advantage Fund | 4.19 | 15.75 | 10.06 | 16.87 | 11.20 | 11.65 | 7.27 | 0.46 |
| ITI Balanced Advantage Fund | 3.81 | 13.14 | 6.64 | 11.45 | — | — | 7.87 | 0.20 |
| Kotak Balanced Advantage Fund | 5.31 | 17.89 | 8.78 | 15.26 | — | — | 7.61 | 0.39 |
| LIC MF Balanced Advantage Fund | 4.84 | 17.99 | — | — | — | — | 7.61 | 0.08 |
| Mahindra Manulife Balanced Advantage Fund | 4.00 | 16.70 | — | — | — | — | 8.93 | -0.02 |
| Nippon India Balanced Advantage Fund | 3.37 | 16.38 | 8.84 | 16.50 | 10.64 | 11.94 | 8.08 | 0.40 |
| NJ Balanced Advantage Fund | 4.31 | 16.78 | — | — | — | — | 9.05 | -0.07 |
| SBI Balanced Advantage Fund | 7.24 | 19.37 | — | — | — | — | 6.34 | 0.12 |
| Tata Balanced Adv Fund | 4.37 | 18.14 | 10.40 | 16.67 | — | — | 7.23 | 0.45 |
| Union Balanced Advantage Fund | 4.15 | 14.89 | 6.99 | 14.25 | 10.86 | — | 7.98 | 0.34 |
| WOC Balanced Advantage Fund | — | — | — | — | — | — | 6.73 | 0.71 |
| Category Average – Balanced Advantage Fund | 4.65 | 17.86 | 9.46 | 15.69 | 10.17 | 10.81 | 8.44 | 0.29 |
| CRISIL Composite Bond Index | 4.33 | 9.31 | 4.55 | 4.94 | 7.77 | 7.41 | 2.89 | -0.09 |
| CRISIL Hybrid 35+65 – Aggressive Index | 3.03 | 19.19 | 8.79 | 17.92 | 11.95 | 12.43 | 10.47 | 0.34 |
| CRISIL Short Term Bond Index | 3.85 | 7.47 | 4.85 | 5.36 | 7.23 | 7.11 | 1.69 | -0.09 |
| NIFTY 50 – TRI | 2.38 | 24.00 | 10.65 | 23.82 | 13.22 | 13.99 | 15.45 | 0.36 |
| S&P BSE 200 – TRI | 2.24 | 24.57 | 10.83 | 25.08 | 13.35 | 14.48 | 15.81 | 0.37 |
| S&P BSE SENSEX – TRI | 2.98 | 24.55 | 11.21 | 23.62 | 13.71 | 14.50 | 15.60 | 0.36 |
Data as of June 19, 2023
The securities quoted are for illustration only and are not recommendatory.
Direct Plan-Growth option considered.
Returns considered are point-to-point and expressed in %.
Returns over 1 year are compounded annualised; else absolute.
Standard Deviation indicates Total Risk, while Sharpe and Sortino Ratios measure the Risk-Adjusted Return. They are calculated over a 3-Yr period assuming a risk-free rate of 6% p.a
Past performance is not an indicator of future returns.
The table above is NOT a recommendation as such. Speak to your investment advisor for further assistance before investing.
Mutual Fund investments are subject to market risks. Read all scheme-related documents carefully.
(Source: ACE MF; Data collated by PersonalFN Research)
The table above displays that not all Multi-Asset Funds have clocked appealing returns; some have underperformed. That said, Multi-Asset Funds as a category has fared better than Balanced Advantage Funds (which manage their assets between equity and debt dynamically) across time frames.
Note that when the fund manager rightly perceives the outlook for each asset class and accordingly timely rebalances the portfolio, a Multi-Asset Fund usually generates significant alpha, i.e., outperforms the benchmark returns. With a nimble approach and timely portfolio rebalancing, a Multi-Asset Fund may also protect against downside risk.
Table 2: Performance of Multi-Asset Funds v/s Balanced Advantage Funds
| Scheme Name | Bull Phase | Bear Phase | Bull Phase | Bear Phase | Bull Phase | Bear Phase | Bull Phase | |
| 09-Mar-09 To 05-Nov-10 | 05-Nov-10 To 20-Dec-11 | 20-Dec-11 To 03-Mar-15 | 03-Mar-15 To 25-Feb-16 | 25-Feb-16 To 14-Jan-20 | 14-Jan-20 To 23-Mar-20 | 23-Mar-20 To 19-Jun-23 | ||
| Aditya Birla SL Multi Asset Allocation Fund | — | — | — | — | — | — | — | |
| Axis Multi Asset Allocation Fund | — | 1.31 | 12.42 | -3.88 | 11.78 | -25.45 | 23.41 | |
| Baroda BNP Paribas Multi Asset Fund | — | — | — | — | — | — | — | |
| HDFC Multi-Asset Fund | 19.47 | 5.43 | 12.43 | 1.65 | 8.99 | -25.96 | 26.93 | |
| ICICI Pru Multi-Asset Fund | 75.36 | -19.67 | 28.74 | -18.75 | 16.97 | -30.43 | 34.92 | |
| Motilal Oswal Multi Asset Fund | — | — | — | — | — | — | — | |
| Nippon India Multi Asset Fund | — | — | — | — | — | — | — | |
| Quant Multi Asset Fund | 4.06 | 6.33 | 7.24 | 5.04 | 8.34 | -31.15 | 45.02 | |
| SBI Multi Asset Allocation Fund | 11.35 | 2.77 | 12.71 | 6.45 | 9.55 | -16.30 | 19.32 | |
| Tata Multi Asset Opp Fund | — | — | — | — | — | — | 26.72 | |
| UTI Multi Asset Fund | 56.99 | -9.90 | 15.62 | -15.43 | 10.27 | -24.24 | 22.60 | |
| WOC Multi Asset Allocation Fund | — | — | — | — | — | — | — | |
| Category Average – Multi Asset Allocation Fund | 33.45 | -2.29 | 14.86 | -4.15 | 10.99 | -25.59 | 28.42 | |
| Aditya Birla SL Balanced Advantage Fund | 55.25 | -16.61 | 18.28 | -10.92 | 15.04 | -25.98 | 23.58 | |
| Axis Balanced Advantage Fund | — | — | — | — | — | -15.35 | 16.28 | |
| Bandhan Balanced Advantage Fund | — | — | — | -5.93 | 10.56 | -23.66 | 20.61 | |
| Bank of India Balanced Advantage Fund | — | — | — | -3.04 | 5.63 | -13.70 | 15.88 | |
| Baroda BNP Paribas Balanced Advantage Fund | — | — | — | — | — | -19.06 | 24.83 | |
| HDFC Balanced Advantage Fund | 89.12 | -22.83 | 22.82 | -18.03 | 16.48 | -33.25 | 34.21 | |
| HSBC Balanced Advantage Fund | — | — | 30.16 | -12.30 | 10.12 | -18.59 | 17.10 | |
| ICICI Pru Balanced Advantage Fund | 46.27 | -9.78 | 24.22 | -6.71 | 14.64 | -26.73 | 23.85 | |
| ITI Balanced Advantage Fund | — | — | — | — | — | -32.43 | 18.44 | |
| Kotak Balanced Advantage Fund | — | — | — | — | — | -25.61 | 22.98 | |
| LIC MF Balanced Advantage Fund | — | — | — | — | — | — | — | |
| Mahindra Manulife Balanced Advantage Fund | — | — | — | — | — | — | — | |
| Nippon India Balanced Advantage Fund | 92.13 | -26.30 | 29.10 | -22.25 | 16.21 | -20.91 | 20.74 | |
| NJ Balanced Advantage Fund | — | — | — | — | — | — | — | |
| SBI Balanced Advantage Fund | — | — | — | — | — | — | — | |
| Tata Balanced Adv Fund | — | — | — | — | — | -19.37 | 22.54 | |
| Union Balanced Advantage Fund | — | — | — | — | — | -23.59 | 22.21 | |
| WOC Balanced Advantage Fund | — | — | — | — | — | — | — | |
| Category Average – Balanced Advantage Fund | 70.69 | -18.88 | 24.92 | -12.54 | 13.36 | -23.68 | 22.68 | |
| CRISIL Composite Bond Index | 5.11 | 6.82 | 9.13 | 6.06 | 8.83 | 0.86 | 6.65 | |
| CRISIL Hybrid 35+65 – Aggressive Index | 93.97 | -30.87 | 20.65 | -11.46 | 14.37 | -25.07 | 24.53 | |
| CRISIL Short Term Bond Index | 5.25 | 7.40 | 9.25 | 7.68 | 8.18 | -0.01 | 6.68 | |
| S&P BSE 200 – TRI | 87.03 | -27.65 | 26.88 | -20.04 | 17.14 | -37.68 | 34.93 | |
| NIFTY 50 – TRI | 73.60 | -24.62 | 25.26 | -21.71 | 17.45 | -38.27 | 33.65 | |
| S&P BSE 200 – TRI | 79.43 | -24.19 | 25.14 | -20.04 | 17.14 | -37.68 | 34.93 | |
Data as of June 19, 2023
The securities quoted are for illustration only and are not recommendatory.
Direct Plan-Growth option considered.
Returns considered are point-to-point and expressed in %.
Returns over 1 year are compounded annualised; else absolute.
Past performance is not an indicator of future returns.
The table above is NOT a recommendation as such. Speak to your investment advisor for further assistance before investing.
Mutual Fund investments are subject to market risks. Read all scheme-related documents carefully.
(Source: ACE MF; Data collated by PersonalFN Research)
Barring the knee-jerk reaction of the Indian equity markets in view COVID-19 pandemic, in all other bear phases Multi-Asset Funds have protected the downside risk better than the Balanced Advantage Funds (also known as Dynamic Asset Allocation Funds), as seen in Table 2. Even in the recent bull phase since the low of March 23, 2020, the Multi-Asset Fund category has rewarded investors better than the Balanced Advantage Funds category.
[Read: Best Multi Asset Allocation Funds to Invest in 2023]
Who should invest in Multi-Asset Funds?
Investors with a moderate-to-high risk appetite having an investment time horizon of 3 to 5 years seeking a decent long-term capital appreciation may consider investing in some of the best Multi-Asset Funds. It would adduce the following key benefits:
-
✓ Provide diversification
-
✓ Benefit from the research capabilities of a professional fund management team
-
✓ Provide relief from analysing and deciding on the asset allocation, timing the market, and rebalancing the portfolio
-
✓ Possibly lower the cost of investing
-
✓ Reduce risk and optimise returns
-
✓ And make portfolio tracking easy (instead of tracking different schemes across categories and sub-categories therein)
Furthermore, most Multi-Asset Funds have a tax advantage as usually they hold a predominant portion of their net assets in equities. In other words, most often they are classified as equity-oriented hybrid schemes. This brings in tax efficiency since the capital gains are taxed like any other equity-oriented mutual fund scheme. Having said that, be mindful of schemes positioned as a ‘Multi-Asset Fund of Fund’ — which are classified as non-equity oriented or debt mutual fund schemes from a taxation standpoint, wherein the indexation is no longer available on capital gain and taxed at the marginal rate of taxation, i.e., as per one’s income-tax slab.
Be a thoughtful investor and choose your Multi-Asset Funds carefully at a market high. Several fund houses are expected to come out with New Fund Offers (NFOs) of Multi-Asset Funds, but it would be wise to give them a miss and consider the existing ones with a proven track record.
Happy Investing!
This article first appeared on PersonalFN here


