
Equity market in the recent past has been taking investors on a roller coaster ride — fluctuating between thrilling highs and dangerous lows. During such uncertain time, a multi-cap approach that has the flexibility to shift its portfolio in line with changing market conditions can prove to be a worthy bet for investors.
HDFC Equity Fund is one such multi cap fund that aims to generate long-term capital appreciation by investing predominantly in equity and equity related instruments.
Launched in January 1995, the fund’s asset size is among the largest in the category at Rs 22,491 crore. It is managed by ace fund manager Mr Prashant Jain, while Mr Amar Kalkundrikar is the co-fund manager looking into the overseas equities in the portfolio.
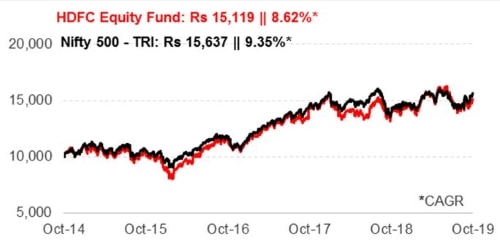
Graph 1: Growth of Rs 10,000 if invested in HDFC Equity Fund 5 years ago
Data as on October 29, 2019
(Source: ACE MF)
Over the last 5 years, HDFC Equity Fund has performed like an ordinary fund, with multiple bouts of underperformance. Had you invested Rs 10,000 in HDFC Equity Fund five years back on October 29, 2014 it would now be worth Rs 15,119 (calculated on October 29, 2019). This translates into compounded annualised growth rate of 8.62%. In comparison, a simultaneous investment of Rs 10,000 in its benchmark Nifty 500 – TRI would have grown to Rs 15,637 (a CAGR of 9.35%). As we can see in the chart above, the fund has failed to generate lead over the benchmark in the last 5 years.
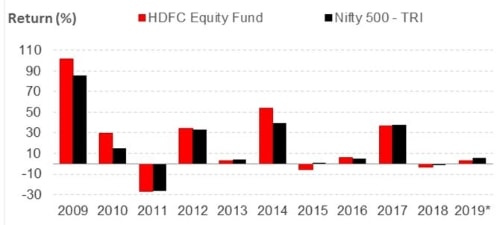
Graph 2: HDFC Equity Fund year-on-year performance
*YTD as on October 29, 2019
(Source: ACE MF)
The year-on-year performance comparison of HDFC Equity Fund vis-à-vis its benchmark Nifty 500 – TRI shows that the fund managed to outperform the index in just 4 out of last 10 calendar years. The fund’s performance was nearly in line with the benchmark in CY 2011, CY 2012 and CY 2017. In CY 2018 the fund struggled to limit the downside and trailed the benchmark by a significant margin. It has underperformed the benchmark in the current year as well.
Table: HDFC Equity Fund performance vis-a-vis category peers
| Scheme Name | Corpus (Cr.) | 1-year (%) | 2-year (%) | 3-year (%) | 5-year (%) | Std Dev | Sharpe |
| Kotak Standard Multicap Fund | 26,991 | 4.61 | 10.00 | 14.72 | 17.56 | 13.13 | 0.08 |
| JM Multicap Fund | 139 | 1.25 | 7.45 | 14.66 | 15.84 | 14.22 | 0.09 |
| Edelweiss Multi-Cap Fund | 456 | 0.94 | 11.35 | 14.19 | NA | 14.29 | 0.08 |
| HDFC Equity Fund | 22,491 | 4.22 | 9.57 | 14.12 | 13.48 | 15.56 | 0.04 |
| Principal Multi Cap Growth Fund | 847 | -3.94 | 7.80 | 13.74 | 14.79 | 15.39 | 0.02 |
| Aditya Birla SL Equity Fund | 11,247 | 0.00 | 6.89 | 13.57 | 16.37 | 13.61 | 0.00 |
| Canara Rob Equity Diver Fund | 1,438 | 5.11 | 11.60 | 13.53 | 12.62 | 13.19 | 0.09 |
| Motilal Oswal Multicap 35 Fund | 13,235 | -2.87 | 6.44 | 13.41 | 17.57 | 15.07 | 0.04 |
| Parag Parikh Long Term Equity Fund | 2,205 | 3.75 | 11.57 | 13.01 | 14.95 | 8.97 | 0.13 |
| SBI Magnum Multicap Fund | 8,073 | 1.70 | 8.97 | 12.88 | 17.32 | 13.26 | 0.06 |
| DSP Equity Fund | 2,786 | 1.51 | 8.31 | 12.53 | 14.09 | 15.40 | 0.06 |
| ICICI Pru Multicap Fund | 4,253 | 2.95 | 8.61 | 12.41 | 15.06 | 13.07 | -0.01 |
| Quant Active Fund | 8 | 0.32 | 9.96 | 11.35 | 16.11 | 13.78 | 0.03 |
| UTI Equity Fund | 9,536 | 2.75 | 10.49 | 11.30 | 13.10 | 13.42 | 0.04 |
| BNP Paribas Multi Cap Fund | 706 | -1.85 | 6.32 | 11.27 | 14.71 | 14.13 | 0.05 |
| Nippon India Multi Cap Fund | 10,021 | 2.69 | 9.75 | 11.04 | 13.22 | 16.38 | 0.02 |
| PGIM India Diversified Equity Fund | 118 | -0.32 | 6.81 | 10.56 | NA | 14.23 | 0.02 |
| Invesco India Multicap Fund | 905 | -6.73 | 5.58 | 10.55 | 16.60 | 15.97 | 0.00 |
| L&T Equity Fund | 2,643 | -2.34 | 6.47 | 10.37 | 12.72 | 13.02 | 0.00 |
| HSBC Multi Cap Equity Fund | 441 | -5.08 | 4.60 | 9.60 | 12.53 | 16.31 | -0.03 |
| NIFTY 500 – TRI | 0.78 | 8.88 | 12.37 | 12.24 | 13.50 | 0.04 |
Returns are on a rolling basis and in %, calculated using Direct Plan – Growth option. Those depicted over 1-Yr are compounded annualised.
Data as on October 29, 2019
(Source: ACE MF)
*Please note, this table only represents the best performing funds based solely on past returns and is NOT a recommendation. Mutual Fund investments are subject to market risks. Read all scheme related documents carefully. Past performance is not an indicator for future returns. The percentage returns shown are only for indicative purposes.
Although HDFC Equity Fund outpaced the benchmark across rolling time periods, it trailed the category average on a 2-year and 5-year rolling return basis.
The fund stood in the top quartile on a 1-year and 3-year rolling periods, while it lagged behind the top performers on 2-year and 5-year rolling periods. Kotak Standard Multicap Fund, JM Multicap Fund and Edelweiss Multi-Cap Fund were the other top performers in the category.
On risk-return parameters, the fund has registered relatively higher volatility. However, its risk-adjusted returns are in line with the benchmark and category average.
Investment strategy of HDFC Equity Fund
Categorised as multi-cap fund, HDFC Equity Fund is mandated to invest minimum 65% of its assets in equity and equity related instruments. It intends to offer diversification by investing in companies across major industries, economic sectors and market capitalisation that offer an acceptable risk-reward balance. The fund seeks to predominantly invest in companies that:
- Are likely to achieve above average growth
- Enjoy distinct competitive advantages, and
- Have superior financial strength
The fund has the flexibility to invest a portion of its assets in debt and money market instruments, and units of REITs and InvITs. However, it prefers to remain fully invested in equities.
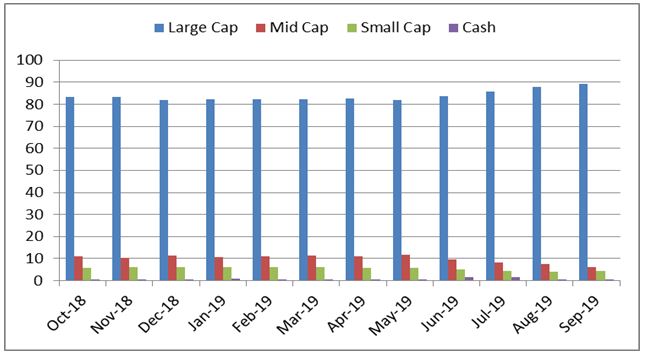
Graph 3: HDFC Equity Fund Portfolio allocation and market capitalisation trend
Holding (in %) as on September 30, 2019
(Source: ACE MF)
HDFC Equity Fund has the flexibility to invest in equities across market capitalisation, but it allocates majority of the portfolio in large caps. In the last one year, the fund has gradually increased allocation towards large caps to around 90% from around 80%. Meanwhile, allocation towards mid and small caps has been reduced. Its allocation towards mid caps has been in the range of 6-11% and that of small caps has been around 5%. As the fund remains fully invested in equities, its cash holding is usually well within 1% of its assets.
Graph 4: HDFC Equity Fund top portfolio holdings

Holding (in %) as on September 30, 2019
(Source: ACE MF)
As on September 30, 2019 HDFC Equity Fund held 44 stocks in its portfolio. The top 10 stocks constitute a significant 62.4% of the portfolio. ICICI Bank is the top holding in the portfolio with an allocation of 9.9%, closely followed by Larsen & Toubro (9.4%), Infosys (8.4%) and SBI (8.3%). Rest of the stocks in the top 10 holdings have allocation in the range of 3-6%.
The fund’s holding is mainly concentrated towards five sectors that constitute around 75% of the portfolio. It has the highest allocation towards Bank at around 30%, followed by Infotech and Engineering (13% each) and Power and Petroleum Products (10% each). Finance, Consumption, Minerals and Pharmaceuticals are the other prominent sectors in the portfolio.
Top contributors
Among the domestic equities in the portfolio, ICICI Bank contributed the most to the fund’s return in the last one year with a weighted return of 3.9%. Larsen & Toubro, Infosys and HDFC Bank, were the other top contributors to the portfolio gains. These stocks are part of the fund’s top holdings.
On the other hand stocks like GAIL (India), Tata Steel, Vedanta and Cipla eroded some of its gains in the last one year.
Suitability of HDFC Equity Fund
HDFC Equity Fund’s multi-cap approach gives it the flexibility to manoeuvre its portfolio in line with changing market conditions. However, its substantially high allocation towards large caps could limit its potential for high growth. Though large caps are known to provide stability across market phases, the fund’s concentrated bets towards few selected stocks and sectors could prove risky if any of these stocks/sectors come under pressure.
The fund’s performance track record over the years raises some concerns about its consistency. Further, the higher volatility registered by it means that it is suitable for aggressive investors with a higher risk-appetite and investment horizon of at least five years.
Note: This write up is for information purpose and does not constitute any kind of investment advice or a recommendation to Buy / Hold / Sell a fund. Returns mentioned herein are in no way a guarantee or promise of future returns. As an investor, you need to pick the right fund to meet your financial goals. If you are not sure about your risk appetite, do consult your investment consultant/advisor. Mutual Fund Investments are subject to market risks, read all scheme related documents carefully.
This article first appeared on PersonalFN here.


