
In the last couple of years, stocks in the large cap segment have witnessed strong rally as opposed to their mid and small cap counterparts, showcasing its ability to withstand volatile market conditions. These being stocks of well-established companies having reliable brand equity, offer stability and have the potential to keep growing in the years to come. The stability of growth in the large cap segment is what makes large cap funds suitable for long term goals like retirement, children’s future, etc.
While large cap index have been driving the markets, the performance of many actively managed large cap funds in the last couple of years raised doubts regarding their ability to outpace benchmark.
SBI Bluechip Fund is one such large cap fund that struggled to generate alpha in the last couple of years. The fund aims to create long term growth of capital by investing in companies having good brand equity and are possibly the market leaders in their industries.
Launched in February 2006, SBI Bluechip Fund’s corpus is among the largest in the large cap funds category. The fund is managed by Ms Sohini Andani (since September 2010) who has over 24 years of experience in the area of financial services.
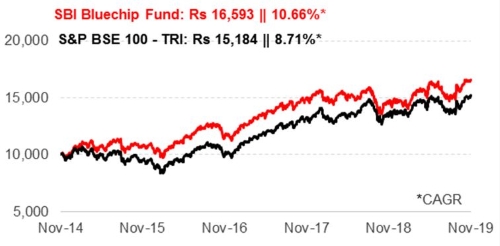
Graph 1: Growth of Rs 10,000 if invested in SBI Bluechip Fund 5 years ago
Data as on November 26, 2019
(Source: ACE MF)
SBI Bluechip Fund has performed fairly well in the last five years. If you had invested Rs 10,000 in SBI Bluechip Fund five years back on November 26, 2014, it would now be worth Rs 16,593 (as calculated on November 26, 2019), growing at a compounded annualised rate of 10.66%. On the other hand, a simultaneous investment of Rs 10,000 in its benchmark S&P BSE 100 – TRI would have grown to Rs 15,184 (a CAGR of 8.71%). The fund has generated decent lead over the benchmark in the last five years. However, in the last one and a half years, its lead over the benchmark has been inconsistent.
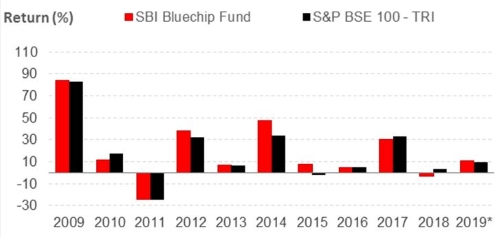
Graph 2: SBI Bluechip Fund’s year-on-year performance
*YTD as on November 26, 2019
(Source: ACE MF)
Launched in February 2006, SBI Bluechip Fund has a track record of more than a decade. The year-on-year performance comparison of the fund vis-à-vis its benchmark S&P BSE 100 – TRI shows that the fund outperformed the index in 4 out of last 10 calendar years, whereas in CY 2011, 2013 and 2016 its performance was nearly in line with the benchmark. Since CY 2016 the fund struggled to outpace the benchmark and even lagged the index in the bull phase of CY 2017 and correction phase which began in CY 2018. Notably, many large cap funds struggled to generate alpha in CY 2018. In the current year the fund has shown significant improvement in performance and has generated decent lead over the index.
Table: SBI Bluechip Fund’s performance vis-a-vis category peers
| Scheme Name | Corpus (Cr.) | 1 Year (%) | 2 Year (%) | 3 Year (%) | 5 Year (%) | Std Dev | Sharpe |
| Axis Bluechip Fund | 8,749 | 11.49 | 16.60 | 16.06 | 14.28 | 12.04 | 0.27 |
| Mirae Asset Large Cap Fund | 15,897 | 6.72 | 11.19 | 15.67 | 16.50 | 12.40 | 0.19 |
| Nippon India Large Cap Fund | 13,091 | 5.03 | 10.50 | 14.36 | 14.74 | 14.46 | 0.13 |
| HDFC Top 100 Fund | 18,507 | 6.95 | 9.26 | 14.19 | 12.31 | 14.00 | 0.12 |
| Canara Rob Bluechip Equity Fund | 257 | 7.65 | 11.36 | 13.66 | 12.60 | 12.11 | 0.19 |
| Indiabulls Blue Chip Fund | 191 | 4.95 | 9.70 | 13.54 | 13.08 | 12.99 | 0.15 |
| ICICI Pru Bluechip Fund | 24,132 | 3.74 | 9.39 | 13.34 | 13.12 | 11.61 | 0.14 |
| Edelweiss Large Cap Fund | 172 | 4.60 | 10.85 | 12.59 | 12.75 | 12.51 | 0.16 |
| HSBC Large Cap Equity Fund | 673 | 3.08 | 7.83 | 12.35 | 11.12 | 12.40 | 0.14 |
| IDFC Large Cap Fund | 457 | 2.22 | 8.09 | 12.14 | 10.11 | 12.32 | 0.13 |
| Invesco India Largecap Fund | 202 | 4.15 | 9.71 | 12.09 | 13.68 | 11.55 | 0.14 |
| Tata Large Cap Fund | 815 | 5.06 | 8.37 | 11.42 | 12.00 | 12.80 | 0.12 |
| UTI Mastershare | 6,174 | 3.59 | 8.98 | 11.32 | 11.93 | 11.57 | 0.12 |
| Essel Large Cap Equity Fund | 104 | 2.79 | 6.32 | 11.32 | 12.32 | 13.02 | 0.11 |
| BNP Paribas Large Cap Fund | 808 | 6.57 | 9.30 | 11.27 | 13.20 | 12.69 | 0.16 |
| PGIM India Large Cap Fund | 329 | 4.33 | 8.11 | 11.22 | 12.56 | 11.61 | 0.14 |
| Kotak Bluechip Fund | 1,444 | 4.27 | 8.29 | 11.18 | 12.95 | 12.51 | 0.13 |
| Aditya Birla SL Frontline Equity Fund | 21,211 | 2.08 | 6.68 | 11.12 | 12.78 | 12.24 | 0.09 |
| LIC MF Large Cap Fund | 306 | 6.18 | 8.65 | 10.99 | 11.31 | 12.24 | 0.13 |
| L&T India Large Cap Fund | 524 | 4.34 | 8.04 | 10.74 | 11.61 | 12.34 | 0.11 |
| Sahara Super 20 Fund | 0.4 | 2.82 | 6.88 | 10.63 | 9.03 | 12.16 | 0.09 |
| SBI BlueChip Fund | 23,585 | 2.72 | 7.25 | 10.62 | 14.17 | 12.58 | 0.09 |
| Baroda Large Cap Fund | 33 | 3.96 | 5.53 | 10.20 | 9.82 | 12.83 | 0.07 |
| DSP Top 100 Equity Fund | 2,641 | 2.65 | 5.97 | 9.88 | 10.13 | 14.49 | 0.07 |
| IDBI India Top 100 Equity Fund | 378 | 2.55 | 5.00 | 9.08 | 11.29 | 12.89 | 0.09 |
| S&P BSE 100 – TRI | 5.29 | 10.25 | 13.26 | 11.36 | 12.28 | 0.15 |
Returns are on a rolling basis and in %, calculated using Direct Plan – Growth option. Those depicted over 1-Yr are compounded annualised.
Data as on November 26, 2019
(Source: ACE MF)
*Please note, this table only represents the best performing funds based solely on past returns and is NOT a recommendation. Mutual Fund investments are subject to market risks. Read all scheme related documents carefully. Past performance is not an indicator for future returns. The percentage returns shown are only for indicative purposes.
SBI Bluechip Fund trailed the benchmark and category average across 1-year, 2-year and 3-year rolling periods. However, during the longer time horizon of 5-year rolling period it performed better than the benchmark as well as the category average.
The fund found itself among the bottom performers in the 1-year, 2-year and 3-year rolling periods. On the contrary, it was among the category toppers in the 5-year rolling period along with other top performers such as Axis Bluechip Fund, Mirae Asset Large Cap Fund and Nippon India Large Cap Fund.
In terms of risk-return parameters, the fund’s volatility has been in line with the category average though slightly higher the benchmark. But its risk-adjusted returns have been far lower than the benchmark and most category peers.
Investment strategy of SBI Bluechip Fund
SBI Bluechip Fund aims to create opportunities for long term capital growth through active management of investments in a diversified portfolio of predominantly large cap stocks. The scheme follows a blend of growth and value style of investing. It picks stocks across sectors through a combination of top down and bottom up approach.
The scheme has the flexibility to invest up to 20% of its assets in debt and money market instruments.
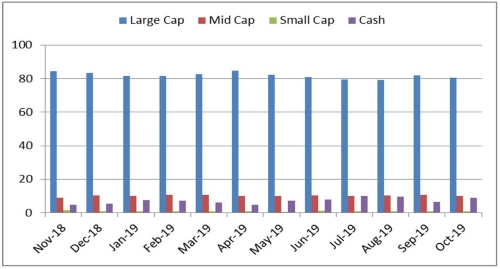
Graph 3: Portfolio allocation and market capitalisation trend in SBI Bluechip Fund
Holding (in %) as on October 31, 2019
(Source: ACE MF)
Categorised as a large cap fund, SBI Bluechip Fund is mandated to invest minimum 80% of its assets in equity and equity related instruments of large cap companies. It has the flexibility to invest a portion of its asset in equities other than large caps, as well as in cash, debt and money market instruments. Accordingly, the fund’s exposure to large caps is in the range of 80-85%. It also seeks opportunities in mid caps where it allocates around 10% of its assets whereas it holds marginal exposure of around 1% or less in small caps. The fund’s holding in cash and cash equivalent is in the range of 5-10%.
Graph 4: Top portfolio holdings in SBI Bluechip Fund

Holding (in %) as on October 31, 2019
(Source: ACE MF)
SBI Bluechip Fund held 50 stocks in its portfolio spread across various sectors, as on October 31, 2019. The top 10 stocks constitute 46.8% of the total holdings with HDFC Bank at top of the list having an allocation of 9.4%. ICICI Bank has the next highest allocation at 6.7%, followed by Larsen & Toubro at 5%. Rest of the stocks in the top 10 holding have allocation in the range of 3-5%.
The fund’s sectoral allocation is highly concentrated towards financial services having an allocation of 27% to Banking stocks and 14.4% to Finance stocks. Consumption, Engineering and Petroleum Products are the other top sectoral holdings. The fund also has substantial holdings in Auto, Infotech and Pharmaceutical sector.
Top contributors
Among the stocks in the fund’s portfolio, HDFC Bank contributed the most to its gain with a weighted return of 2.5%. Stocks like Nestle India, ICICI Bank, HDFC, Kotak Mahindra Bank, Reliance Industries and ICICI Prudential Life Insurance Company which are part of the fund’s top holding also contributed to its gains.
On the other hand, stocks like Mahindra & Mahindra, Sun Pharmaceutical, Motherson Sumi Systems and ITC eroded some of its gains in the last one year.
Suitability of SBI Bluechip Fund
Being a large cap fund, SBI Bluechip Fund invests majority of its assets in large caps that are known to provide stability in the long run. At the same time it seeks opportunities in mid caps that can push up the portfolio gains, though they are riskier.
Though the fund has performed well over longer time horizon, its performance track record over the last few years raises some concerns about consistency and ability to generate superior risk-adjusted returns. Moreover, its concentrated bets towards few selected sectors could prove risky if any of these sectors come under pressure. This makes it suitable for investors with moderately high risk appetite and investment horizon of at least 5 years.
Note: This write up is for information purpose and does not constitute any kind of investment advice or a recommendation to Buy / Hold / Sell a fund. Returns mentioned herein are in no way a guarantee or promise of future returns. As an investor, you need to pick the right fund to meet your financial goals. If you are not sure about your risk appetite, do consult your investment consultant/advisor. Mutual Fund Investments are subject to market risks, read all scheme related documents carefully.


